12. UML Diagrams
Unified Modeling Language (UML) helps us visualize, design, and document software systems. By learning UML, you gain a powerful tool to communicate complex ideas clearly, structure your code effectively, and collaborate better in teams. Whether you're planning a new application or improving an existing one, UML supports thoughtful design and reduces misunderstandings.
12.1 Class Diagram
Class diagrams show the static structure of a system - classes, their attributes, methods, and relationships.
12.1.1 Example: Online Shop System
┌─────────────────────┐         ┌─────────────────────┐
│       Customer      │         │       Product       │
├─────────────────────┤         ├─────────────────────┤
│ - id: int           │         │ - id: int           │
│ - name: string      │         │ - name: string      │
│ - email: string     │ ────────│ - price: double     │
├─────────────────────┤         │ - stock: int        │
│ + addToCart()       │         ├─────────────────────┤
│ + checkout()        │         │ + getPrice()        │
│ + getOrders()       │         │ + updateStock()     │
└─────────────────────┘         └─────────────────────┘
         │                               │
         │                               │
         │                               │
         ▼                               ▼
┌─────────────────────┐         ┌─────────────────────┐
│       Order         │         │    OrderItem        │
├─────────────────────┤         ├─────────────────────┤
│ - id: int           │         │ - quantity: int     │
│ - date: DateTime    │ ────────│ - subtotal: double  │
│ - total: double     │         ├─────────────────────┤
├─────────────────────┤         │ + calculateTotal()  │
│ + calculateTotal()  │         └─────────────────────┘
│ + addItem()         │
└─────────────────────┘
12.2 State Diagram
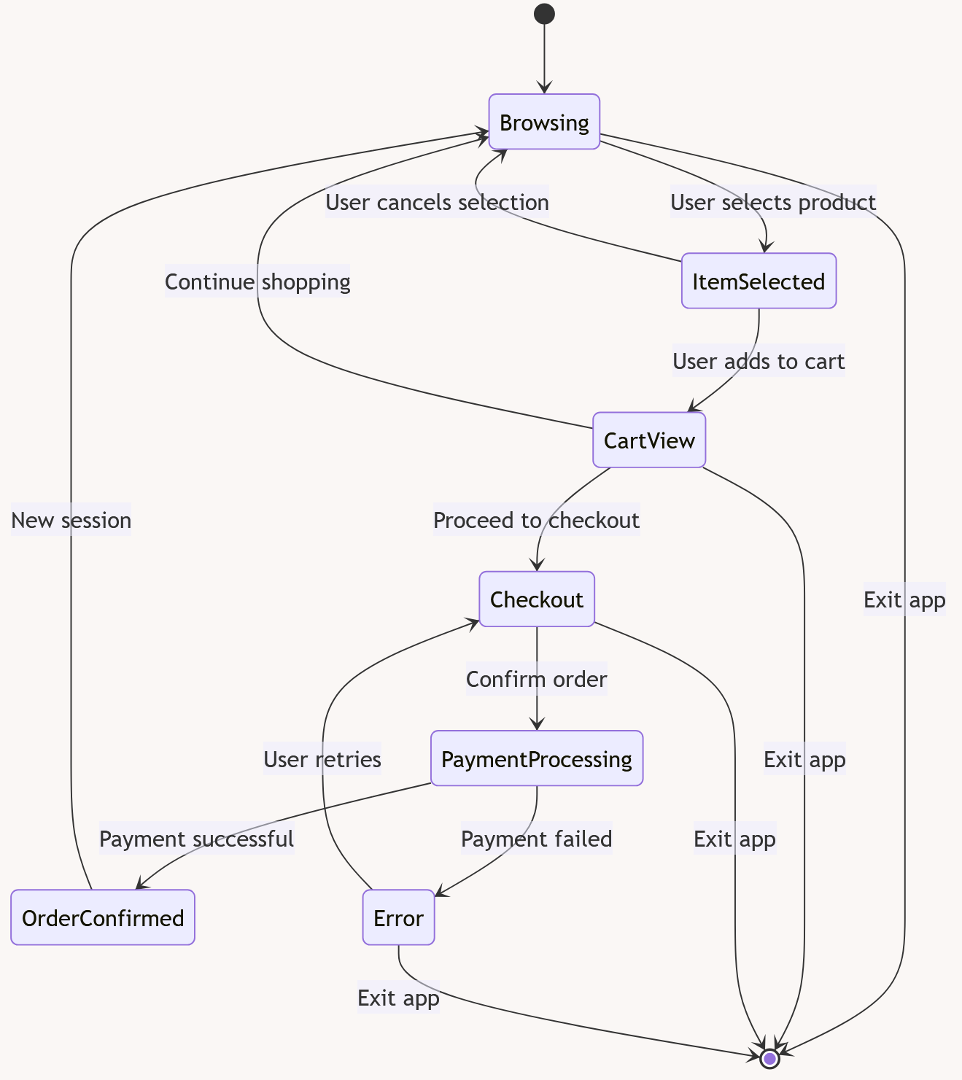
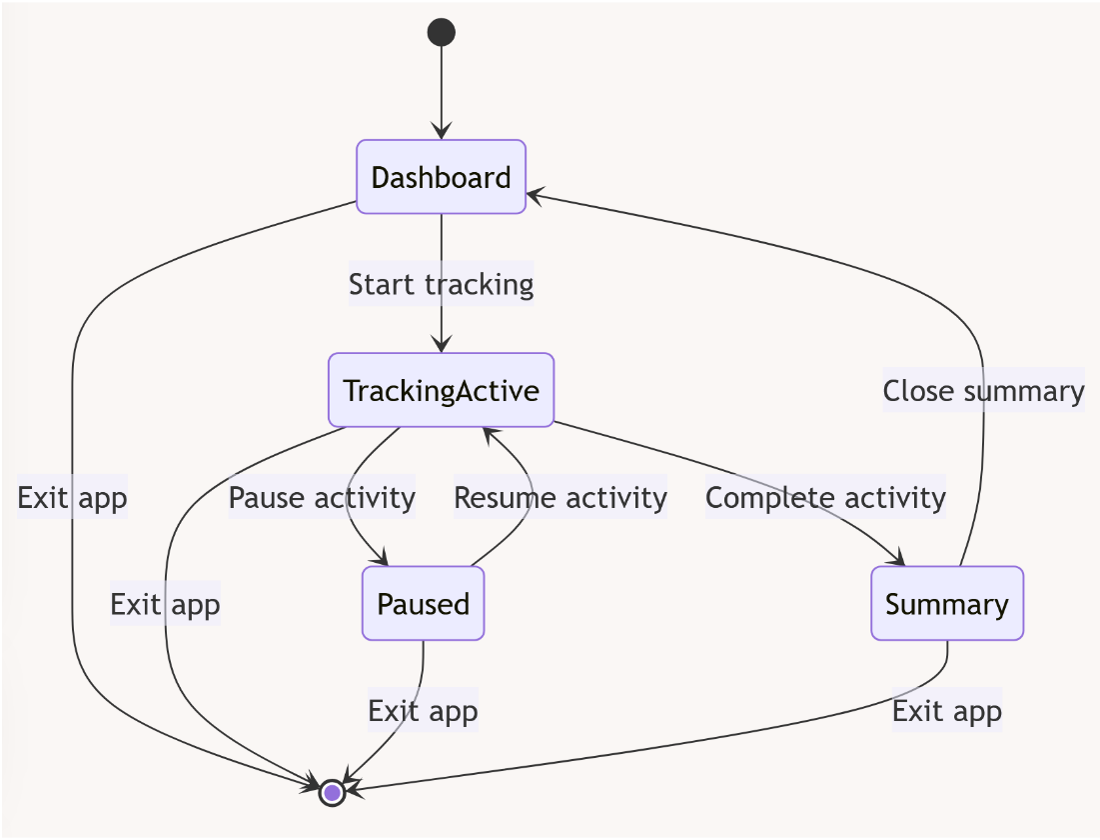
A state diagram shows how an object behaves over time by visualizing its possible states and transitions. It's useful when modeling systems that react differently based on their current condition, like traffic lights, user sessions, or device modes.
- Focus: Lifecycle of an object
- Shows: States, transitions, events, and conditions
Example: Traffic Light
stateDiagram
    [*] --> Red
    Red --> Green : Timer
    Green --> Yellow : Timer
    Yellow --> Red : Timer
Problems with this simplified traffic light
- What happens if a light bulb fails? Or a power outage? This model doesn’t account for fail-safes or maintenance modes.
- It assumes an immediate start in "Red". In reality, systems may require an initialization phase.
Below you will find more complicated examples


12.3 Sequence Diagram
A sequence diagram shows how objects interact in a particular scenario by emphasizing the order of messages exchanged over time. It’s ideal for understanding workflows, like placing an order or logging in.
- Focus: Communication between objects
- Shows: Objects, lifelines, messages (calls), and return values
Example: Online Order Process
sequenceDiagram
    participant Customer
    participant WebUI
    participant OrderService
    participant PaymentService
    participant Database

    Customer->>WebUI: placeOrder(item)
    WebUI->>WebUI: "UI: Processing order"
    WebUI->>OrderService: createOrder(customer, item)
    OrderService->>OrderService: "OrderService: Creating order"
    OrderService->>PaymentService: processPayment(customer, 99.99)
    PaymentService-->>OrderService: true
    OrderService->>Database: saveOrder(customer, item)
    OrderService->>OrderService: "OrderService: Order created successfully"
12.4 Entity-Relationship Diagram (ER Diagram)
An Entity-Relationship (ER) Diagram is a visual tool used in database design to represent:
- Entities (e.g., Student, Course)
- Attributes (e.g., name, credits)
- Relationships (e.g., a student enrols in courses)
ER diagrams help model the structure of a database logically, making it easier to understand how data is connected and organized.
Example: University System
erDiagram
    STUDENT ||--o{ ENROLMENT : enrols
    COURSE ||--o{ ENROLMENT : has
    PROFESSOR ||--o{ COURSE : teaches

    STUDENT {
        int student_id PK
        string name
        string email
    }

    PROFESSOR {
        int professor_id PK
        string name
        string department
    }

    COURSE {
        int course_id PK
        string title
        int credits
        int professor_id FK
    }

    ENROLMENT {
        int enrolment_id PK
        date enrol_date
        string grade
        int student_id FK
        int course_id FK
    }
- Students can enrol in many Courses, and each Course can have many Students. This many-to-many relationship is managed via the ENROLMENT table.
- Professors teach Courses. Each course is taught by one professor (one-to-many).
- The ENROLMENT table includes
- A foreign key to STUDENT
- A foreign key to COURSE
- Additional attributes like enrol_date and grade